Editor’s note: In December of 2016, the Baker Program will embark on its second annual international (and first intercontinental) real estate trek. This year’s destination is Seoul, South Korea. This post is intended as an introduction to the office market in Seoul and was written by Baker Program student Junghwan Kang.
Seoul Office Market Overview
Seoul is the capital city of Korea, and a rising global city that is representative of the economic growth in Asia. As the business and financial hub of Korea, Seoul generates 23% of the country’s overall GDP (Seoul GDP per capita is $35,782), yet it accounts for only 0.6% of the nation’s land area. Major industries in Seoul include services (90%) and manufacturing (7.4%), so it is not surprising that the office market is highly concentrated. Because of the industry concentration, the Seoul office market is affected not only by supply & demand, but also by macro-economic factors such as GDP growth rate, labor markets, and inflation. Therefore, there is a need to look at the macro economy first before reviewing the Seoul office market.
Macro Economy
Global Economy
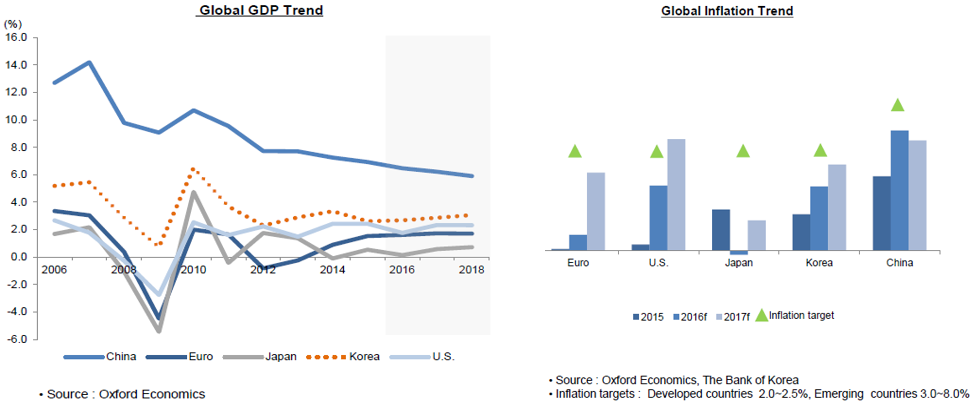
The moderate recovery of the global economy has been led by developed nations for the past several years. However, there is still concern that growth momentum may weaken due to risks that include a slowdown in emerging markets, geopolitical risks such as Brexit, and monetary tightening in the U.S. Also, an environment of persistently low inflation has caused deflationary concern for developed nations and weak commodity prices.
Korean Economy
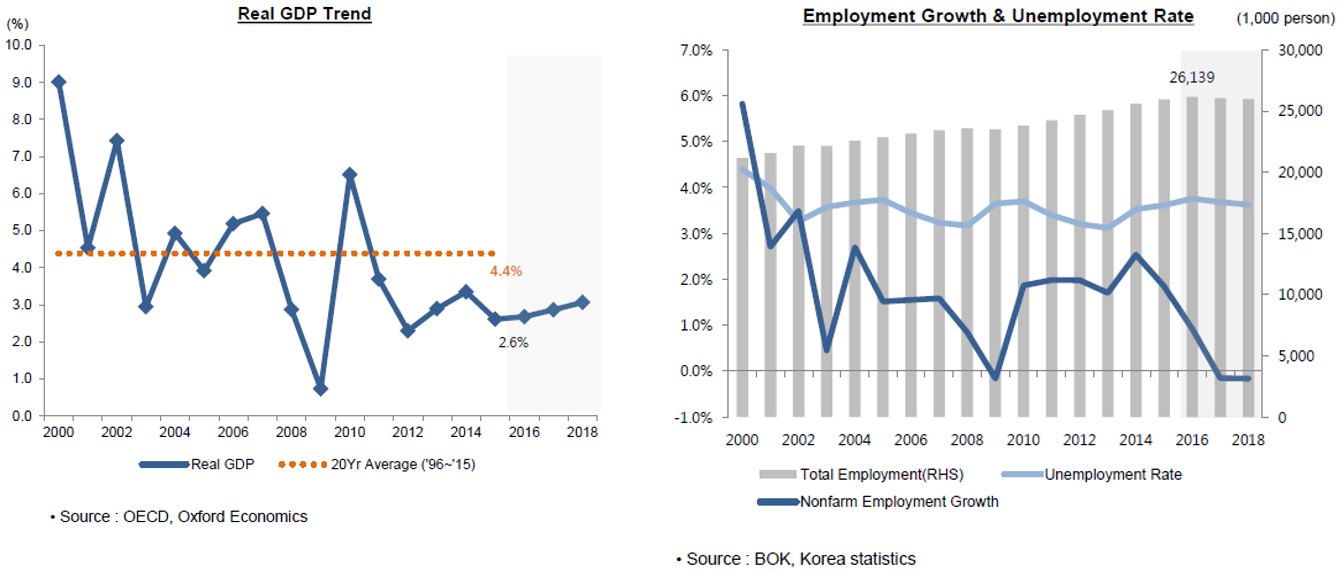
The domestic Korean economy has been experiencing weaker growth due to rising uncertainty in the global economy. Domestic consumption has shown some improvement, recovering from the MERS shocks in 2015. However, export growth has been sluggish due to weak global demand amid China’s slowdown and weak commodity prices. Weaker growth is expected amid rising uncertainty, such as the reverse rotation of investment money due to U.S. tightening. When it comes to the other key elements such as the labor market and currency, labor markets have been slow due to the weakening economic recovery. Total employment in 2016 is forecast to be 26 million (up 201,000) while the unemployment rate ticked up to 3.8%. Sluggish non-farm employment has grown due to financial sector restructuring and a slowdown in fixed investment. As for currency, the Korean Won ($1=1,179 won on 11/21/2016) has been weakening amid the low inflation environment and U.S. tightening. The main reason for this is that inflation is projected to rise in 2016, but to remain generally below the Central Bank target range. Also, considering sluggish exports and domestic demand, there is limited room to raise the Korean benchmark interest rate.
Seoul Office Market
Seoul Office Market Segments
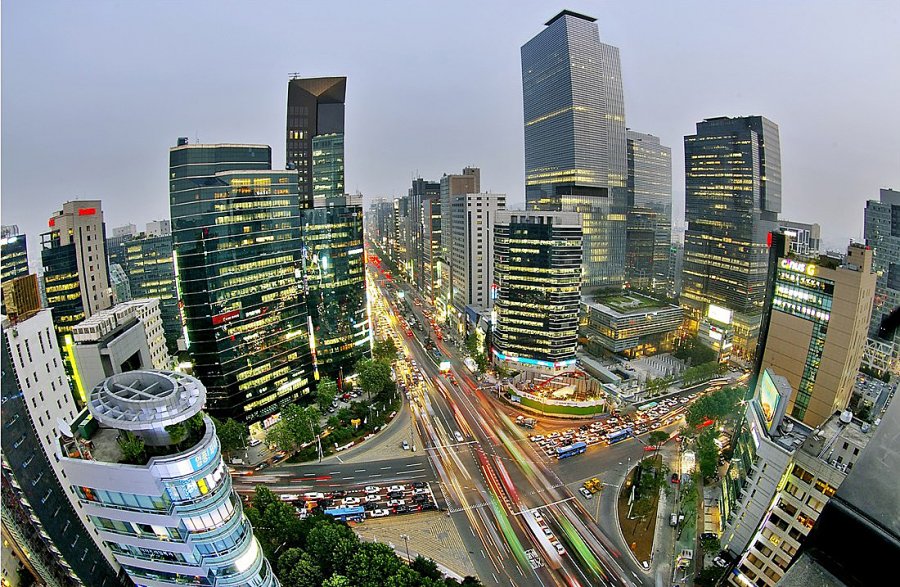
The Seoul office market consists of three different core areas: the CBD (Central Business District), GBD (Gangnam), and YBD (Yeouido). These areas have different development histories and key tenants. The CBD has been developed since 1960, and is the oldest and largest business district in Seoul. Major tenant industries include investment banking, foreign corporation headquarters, trade, and government organizations. On the other hand, GBD has been developed since 1980—relatively later than the Yeouido district—but GBD is the second largest business district with key industries including IT, venture capital, communication and manufacturing. Yeouido district is focused on financial services, consulting, and media tenants.
Leasing Market
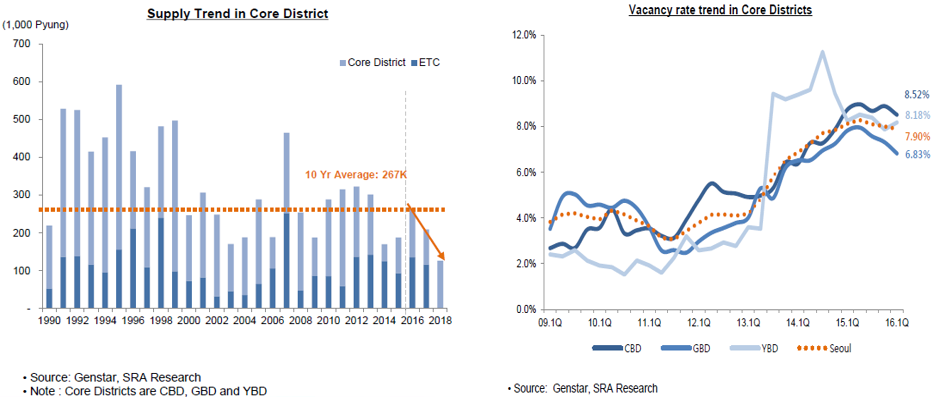
Office demand showed some improvement in Q1 2016, but oversupply still persists. In Q1, net absorption (820,000 pyung, *1 pyung=35.5 sq. ft.) exceeded new supply (630,000 pyung), resulting in a year-over-year increase in the absorption rate (absorption rate Q1 2015 was 67%, compared to Q1 2016 of 131%). Oversupply persists as average new supply (265,000 pyung) has surpassed net absorption (179,000 pyung) since 2015. While new supply is expected to drop below the long-term average for next 3 years, accumulated oversupply will continue to weigh on the leasing market.
The vacancy rate has inched down for the third consecutive quarter, to 7.9%, but there is upward pressure for it to increase going forward. Decreases in 2016 were mainly caused by relocations and expansions from secondary to primary office buildings. However, delivery of new supply (e.g. Parnas Tower and Lotte World Tower) will produce upward pressure in vacancy rates generally. Based upon demand and supply analysis, it is estimated that vacancy in the Core District will rise to 10.5% in 2018 amid lackluster demand.
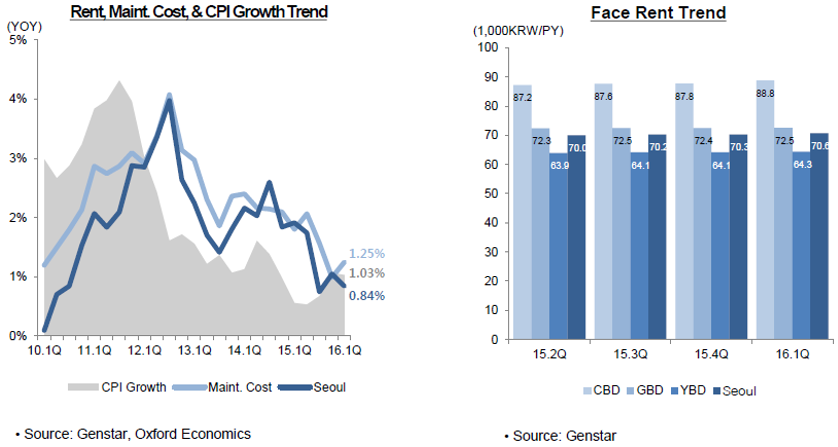
In terms of office rents, they have increased 0.84% quarter-over-quarter, and are likely to remain flat or rise slightly in line with inflation. Free rent fell slightly in Q1 due to vacancy decreases, and are currently at 2.4 months free per year on average.
Capital Market
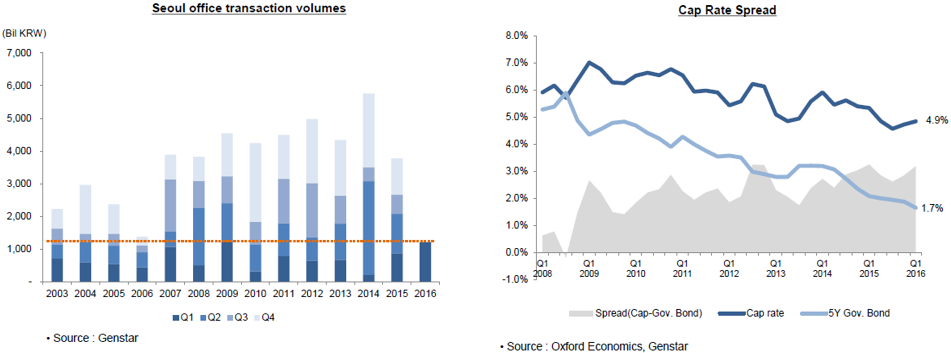
Transaction volume was over 1.2 trillion KRW (=$1.0 billion) in Q1 2016, the highest 1st quarter volume since the 2009 Global Financial Crisis. The volume has surged primarily from mid-range properties which started sales and marketing in the previous year. Lack of Grade A transactions is caused by weakening investor sentiment, and investors have stepped back and reassessed pricing levels. Also, deepening polarization has led to demand being concentrated on newly developed buildings in core districts, in order to buy buildings in advance at relatively lower prices. In terms of prices and cap rates, unit prices have fallen 3.7% to 17.6 million KRW per pyung, and are likely to remain flat or rise slightly in the short term. Due to the growing gap between cap rates and 5-year government bonds, demand for office investment continues. Also, despite a weakened market outlook, limited Grade A transaction opportunities coupled with low interest rates, suggest that continued demand from investors will help capital values to hold steady. In addition, investor preference for stabilized prime assets in core districts show that the price gap is widening.
When it comes to cross-border transaction, volume has been increasing since 2013, and is likely to continue in the near term. With the global low interest environment and Korea’s investment stability compared to other Asian markets, Korea’s office market is watched by overseas investors with interest. The result has been an increase in cross-border investment, with a volume of approximately $595 million in 2015.
