

 Ravikanth Pamidimukkala
Introduction
The New York Metropolitan region is one of the most populous urban agglomerations in the world, and the single largest in North America.[1] It is also one of the most prominent economic centers, with New York City at the epicenter of its growth. With the entire region growing rapidly over the last decade, it is essential to analyze the socio-economic changes in order to understand the impact it has on commercial real estate. With its focus on housing rentals, this study aims to highlight housing costs as a function of rapid transit over time.
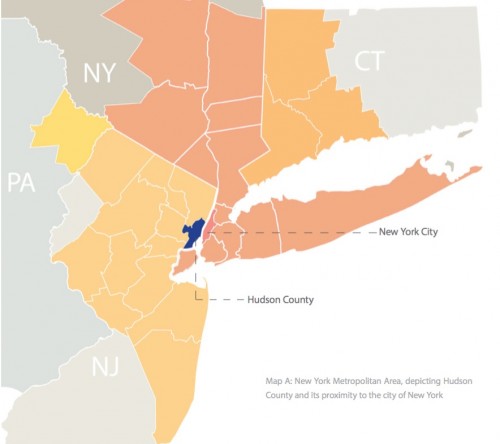
As a part of the overall scheme, housing, household income, and rapid transit are significant indicators to analyze growth within a region. This study examines these indicators in Hudson County, New Jersey, given its proximity to Manhattan and the rapid transformation of the regions of Newport/Jersey City, Hoboken, and Union City, which are being perceived as the “next Brooklyn” for New York City. Nearly 47% of the residents of Jersey City use public transit, which is the second highest in the US.[2] Moreover, tax incentives for living in New Jersey rather than in the state of New York are assumed to be an important factor for residential growth in Hudson County.
Hudson County lies west of the lower Hudson River and New York City. As part of New Jersey’s Gateway Region in the New York metropolitan area, Jersey City is its largest city and county seat.[3] With an estimated increase in population of 10% between 2000 and 2014, Hudson County is the fourth-most populous municipality in the state of New Jersey.[4] With immediate access to the metropolitan area, much of the recent growth has been seen in housing.
With rapid transit allowing quicker access to New York, there is a popular perception that the housing market is having an upswing and appreciating rapidly in the region. Whether this appreciation is uniformly distributed in Hudson County or it follows a specific pattern is important to analyse from both the perspective of having better legislation for encouraging growth in areas of blight, and with a view of capitalizing on growth in areas experiencing an unanticipated upswing. Additionally, this allows potential investors and developers to understand the residential market as a factor of transit, and as a factor of socio-economic indicators, to help them make better decisions.
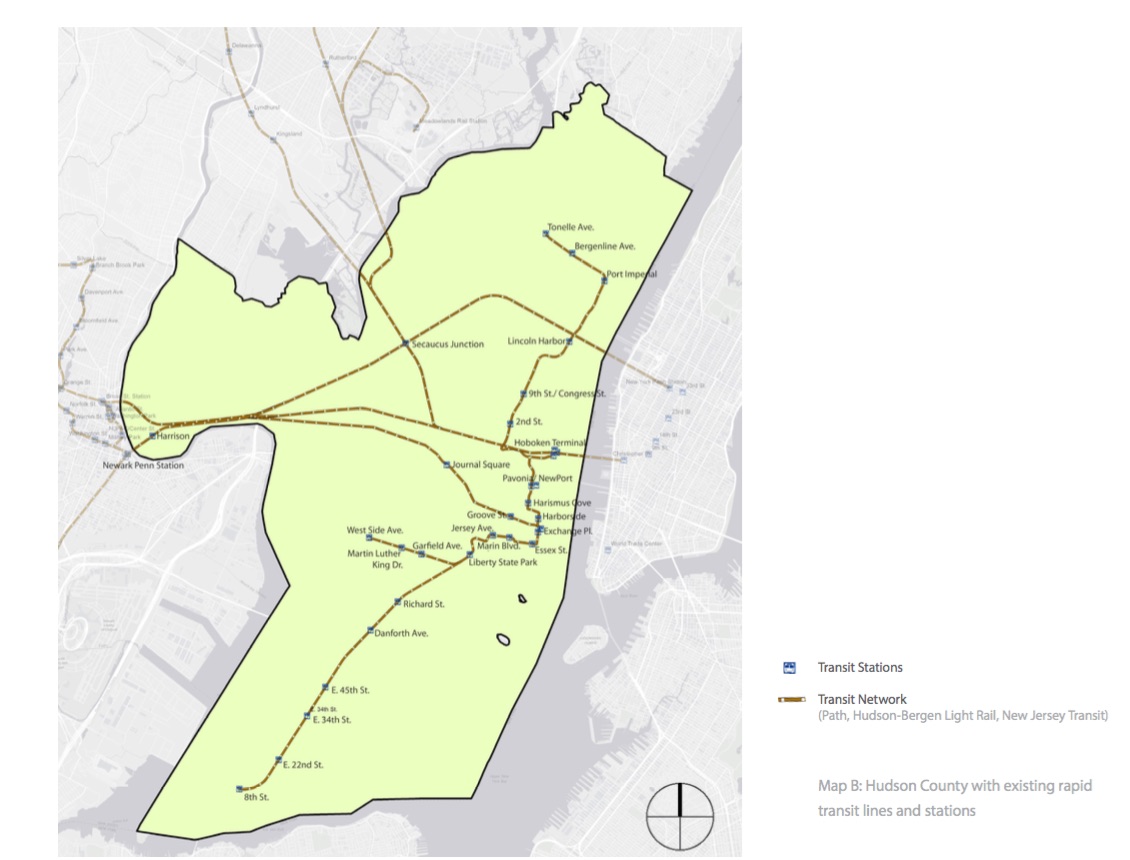
The scope of the analysis is limited to Hudson County and the transit network that serves and connects the people here with the surrounding regions. The data comparison use census block groups of 2000 and 2013, and the comparative analysis follows both a comparison of values within the same year and across the 13- year period, to analyse the transition both as a factor of time and local conditions. The comparative factors shall evaluate housing rentals as a factor of distance from the transit stations, using an incremental radius of quarter mile. This is based on a 10-minute (800 metres/ half-mile) minimum walking distance from a transit station, and the quarter mile being a highly used comparative distance.
Instead of using a network-based analysis, this study employs uniform radial buffers of quarter-miles, for the following reasons: First, most existing station-level direct demand models rely on radial catchment areas. Second, radial-based data are easier to calculate and more readily available, so they are more likely to see widespread use in the future. Third, estimating catchment areas requires an additional, somewhat arbitrary, decision when using Census data: determining the distance from the roadway to include in the catchment area. Fourth, and perhaps most important, the network-based calculations did not improve results in past studies evaluating similar scenarios. This is likely because the parks, paths, and parking lots surrounding stations provide pedestrian access, but rarely show up in available road network files. Manually adding these pedestrian connections, however, is labor-intensive and therefore contrary to the direct demand model’s objective of simplifying ridership predictions. Also, despite advances in the quality and availability of satellite imagery, identifying pedestrian access points still requires site visits to transit stations.[5]
Analysis: Rental Value variations–2000 Census Block Groups
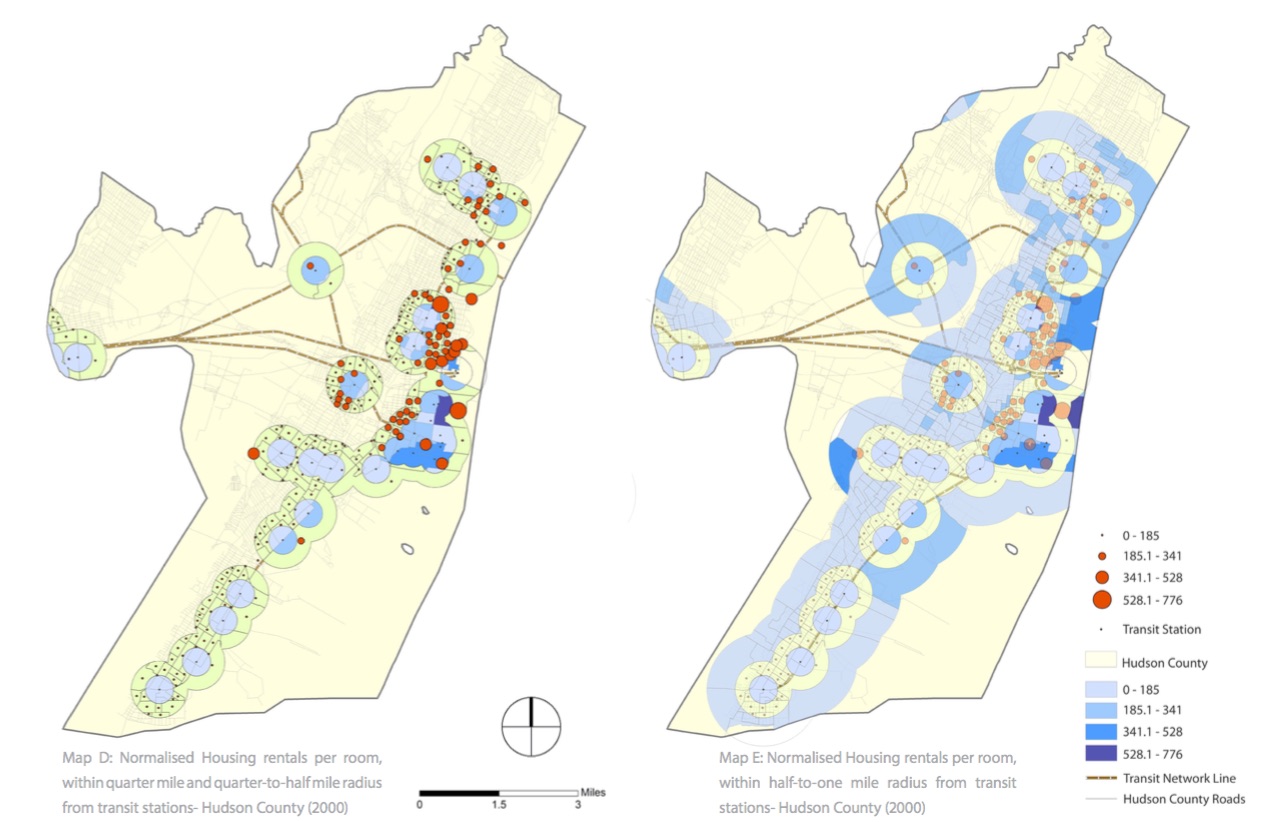
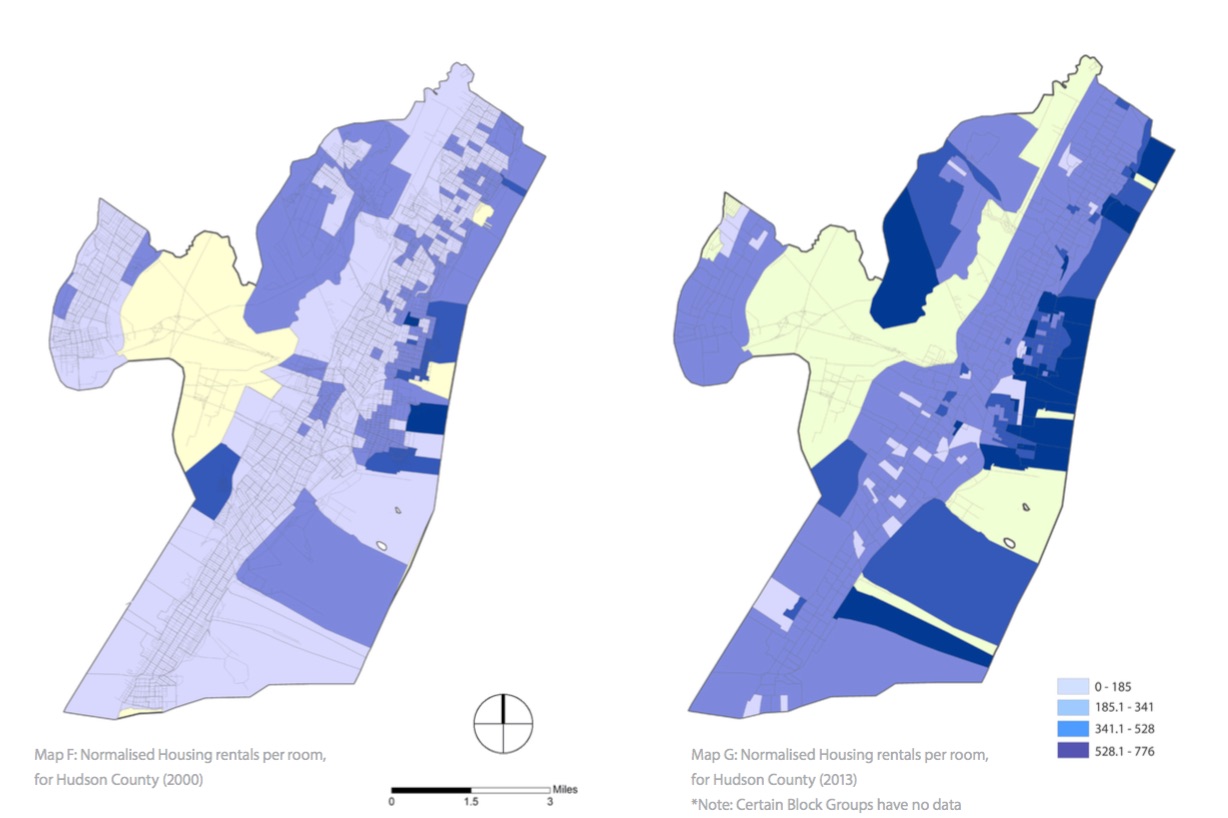
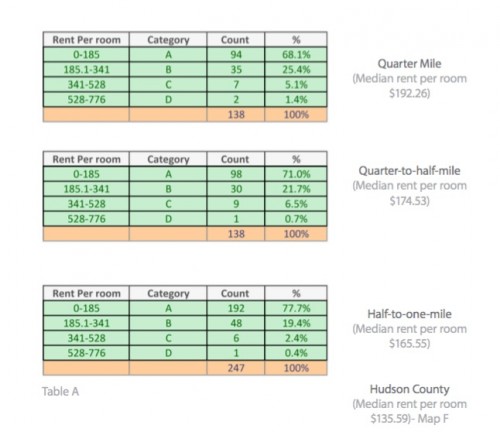 The rental values are classified into four categories, and the median rent per room of the overall Hudson County as per 2000 Census is $135.59, as obtained from Map F. The rental values per room of the properties within the quarter mile radius of transit stations are 42% higher than the median value of the entire county, with the properties in the quarter-to-half mile radius from transit stations 29% higher and values in the half-to-one-mile radius 22% higher. This is a strong indicator that rapid transit has significantly influenced housing prices in 2000, with prices beyond 10- minute walking distance also being affected. Further, the rental values in the quarter mile radius are significantly higher, indicating a much stronger influence of rapid transit.
Analysis: Rental Value Variations–2013 Census Block Groups
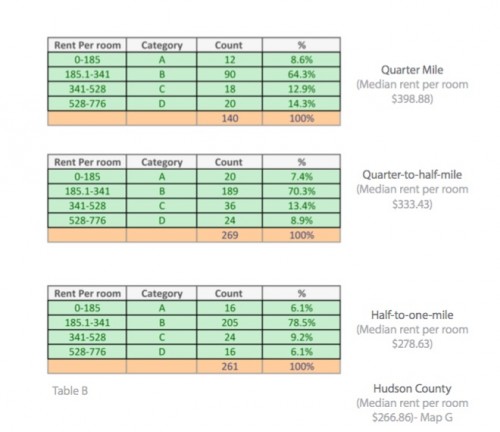 The spatial maps are obtained and the rental values are similarly classified into four categories. The median rent of the overall Hudson County as per 2013 Census is $266.86 per room, as obtained from Map G.
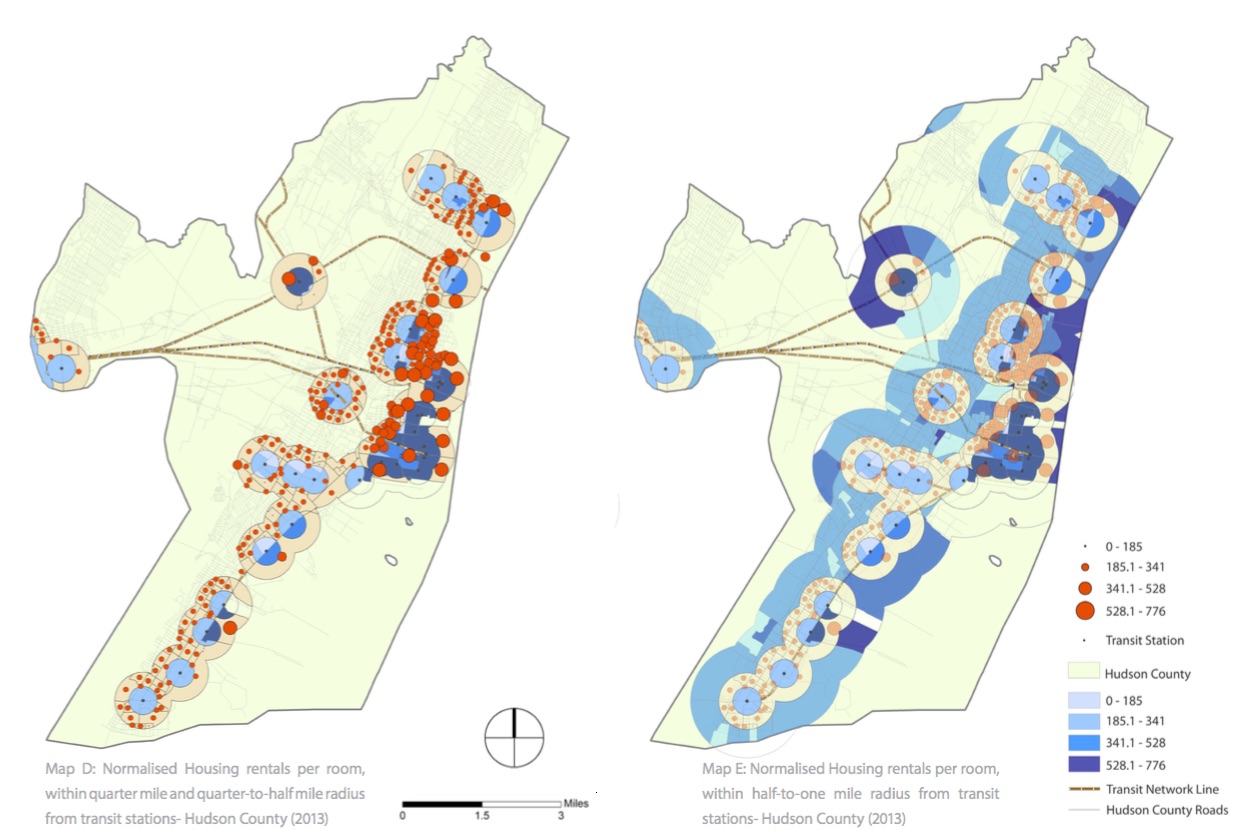
The rental values per room of the properties within the quarter mile radius of transit stations are 49% higher than the median value of the entire county, with the values in the quarter-to-half mile radius from transit stations 25% higher and half-to-one-mile radius 4% higher. Although these values are higher than the median rental values per room of the overall county, compared to the year 2000; rental values within the quarter mile radius have increased while values in the quarter-to-half have reduced, and values in the half-to-one mile have massively declined in comparison to the median values of the overall county in 2013. In 2013, rapid transit continues to have an impact on rental values, but is limited to the quarter mile radius.
Analysis: Rental Value Variations comparing the 2000 vs 2013 Census Block Groups
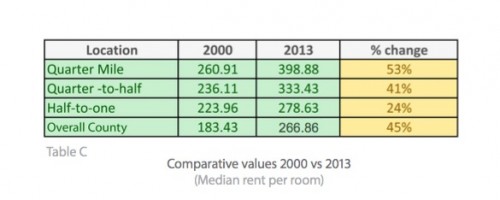 The median rental values per room of the Hudson County as per 2000 and 2013 Census data were: $135.59 and $266.86 respectively (not inflation adjusted). Adjusting the 2000 values for inflation to 2013, we get the following values as shown in Table C. A relative change in values can be observed:
It is essential to note that Hoboken and downtown Jersey City continue to perform better (as observed from the QQ plot and visually from the maps F & G) than the rest of the region. Therefore, an independent assessment for Hoboken (or Jersey City) is essential to understand the premium value of housing in this region.
The rental values per room of the properties within the quarter mile radius of transit stations have increased by 53% in 2013 compared to the year 2000. Within the Quarter-to-half mile radius they have increased by 41% and in the half-to-one-mile radius by 24%. The median values of the overall county have increased by 45%, however, which is higher than the quarter-to-half-mile and half-to-one-mile radius values.
This surprisingly indicates a possibility that rapid transit has not been able to bring about the upswing in rental values as the popular perception suggests.” By contrast, the residential properties within the quarter mile radius have performed significantly well, with an upswing of 9% higher than the average value. The reasons for this could be several: road transport is becoming a more preferred option for transit, or the number of offices has increased in the county, reducing travel to New York, or several other potential local conditions that are causing this effect.
Since the purpose of this study is limited to analyzing the impact of rapid transit on housing values, the local factors that are affecting the overall rental values in the county to increase above transit-influenced regions are not considered, and remain to be examined in a future study.
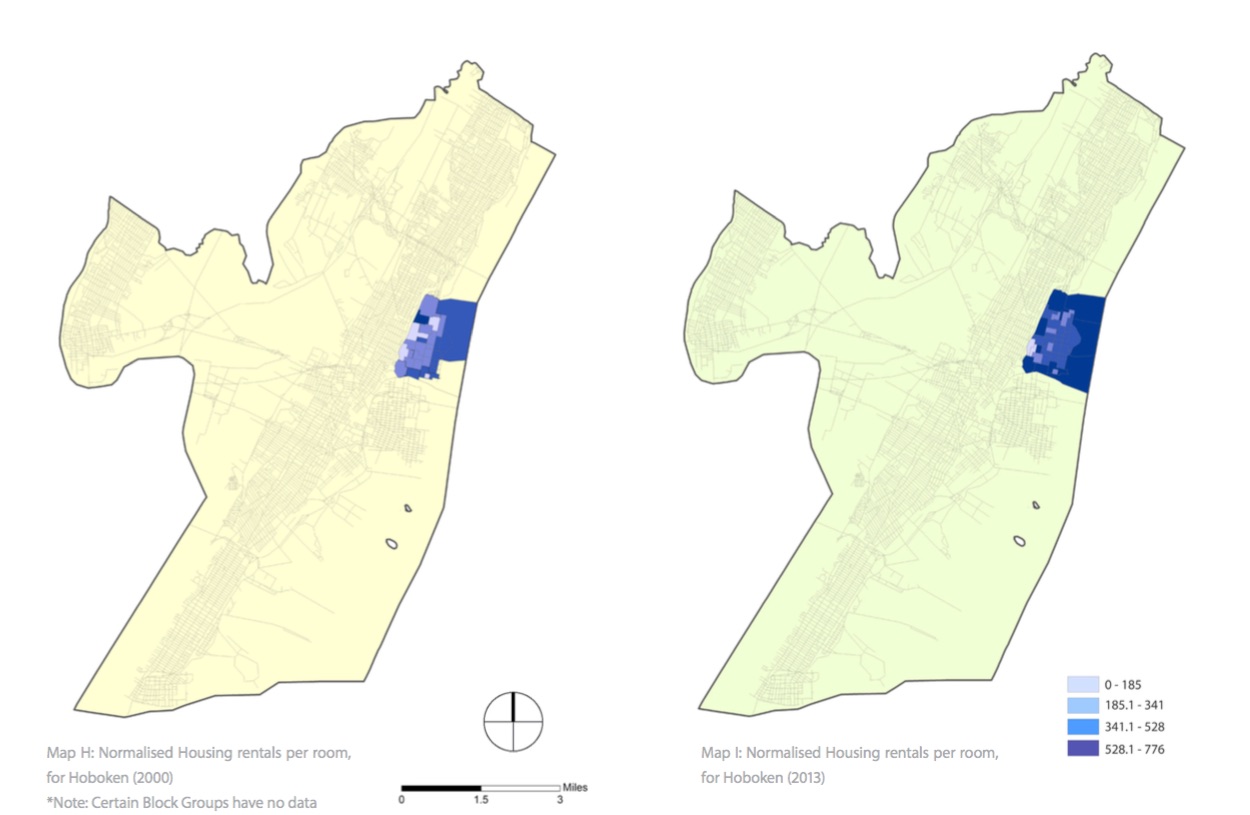
Analysis: Hoboken Rental Value Variations- 2000 vs 2013 Census Block Groups
Hoboken’s population grew by 29.6% from 2000 to 2010, as per census data. Maps H and I indicate the rental values per room, with median values of $273.98 and $570.58, respectively, for 2000 and 2013 (not adjusted to inflation). Adjusting the 2000 value for inflation, the rental value is $370.65 per room.
The rental values per room of the properties in Hoboken in 2000 have been 102% higher than the overall median value, while in 2013 it is 114% higher. The rental values in 2013 have increased by 54% compared to inflation-adjusted 2000 values. This indicates a massive upswing in rental values in Hoboken that follows no definitive spatial pattern with proximity to transit stations, as can be observed from the spatial data in Maps H & I. The proximity to the waterfront could have a significant influence on rental values, and in a future analysis this factor should be taken into consideration.
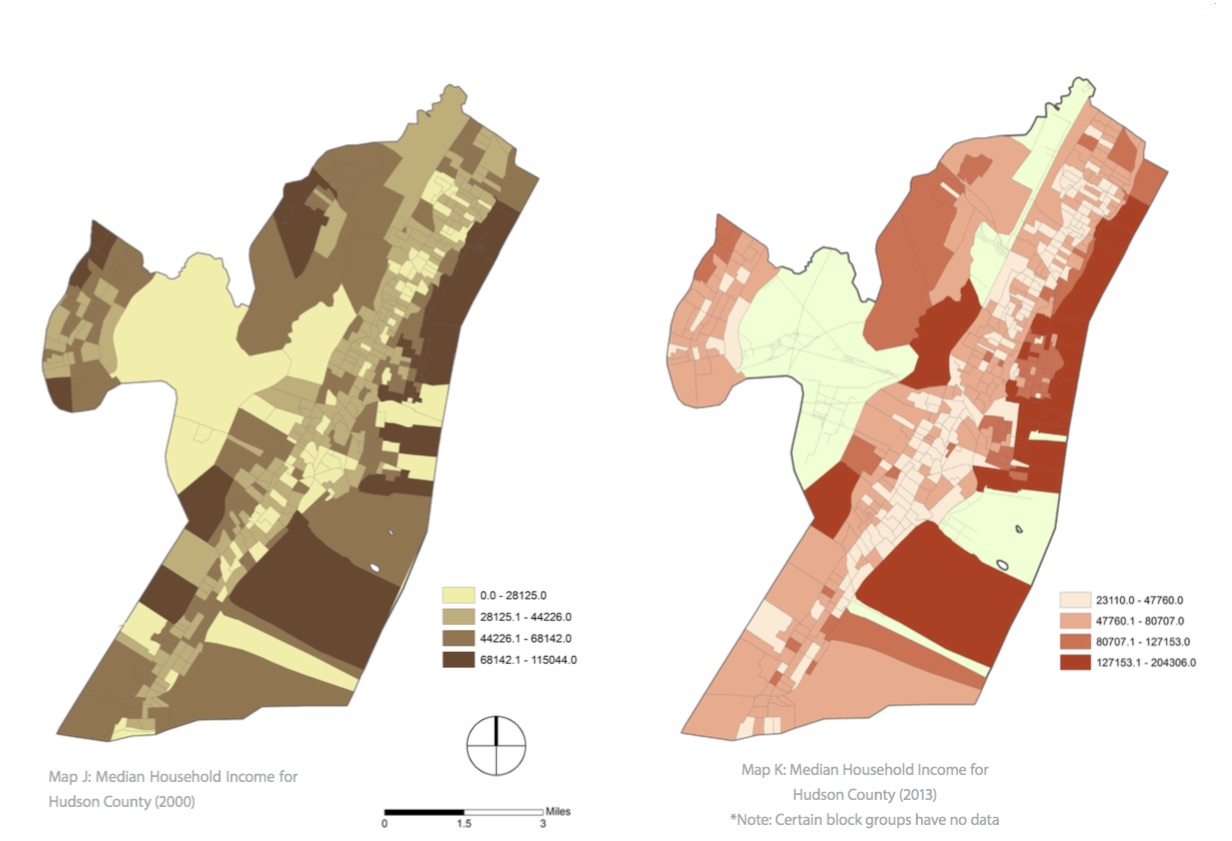
Analysis: Median Household Income comparing the 2000 vs 2013 Census Block Groups
The median Household income for Hudson County for the years 2000 and 2013 were $43,807.93 and $71,155.90, respectively. Adjusting the 2000 value for inflation to 2013, the median household income stands at $59,264.40; indicating a 20% increase in 2013 compared to 2000.
Since the transit stations have had no significant influence beyond the quarter mile radius in influencing rental values, it would not be ideal to carry out a similar study for household income, and therefore the changes in values are evaluated for the overall county, instead of incremental buffers.
Hoboken and downtown Jersey City continue to perform better than the rest of the region even in median household income values, and therefore an independent assessment for Hoboken (or Jersey City) alone would be able to give a perspective of these values
The average household income in Hudson County has increased much lower (20%) than the increase in median rental values (45%), indicating that home owners since 2000 have benefitted more than residents who opted for rentals. This indicates an upward swing in the Net Operating Incomes (NOI), which raises the question of whether property values are following a similar trajectory. In a further study, analyzing property values and cap rates will give a more in-depth understanding of the Hudson County residential market, which is not covered within the scope of this study.
Analysis: Hoboken Median Household Income comparing the 2000 vs 2013 Census Block Groups
The median Household income for Hoboken for the years 2000 and 2013 were $59,554.68 and $143,032.99 respectively. Adjusting the 2000 value for inflation to 2013, the median Household income stands at $80,567.24; indicating a massive 77.53% increase in 2013 compared to 2000.
The median household income values in Hoboken were 36% higher than the overall Hudson County in 2000, and 101% higher in 2013. Comparing these values between 2000 and 2013, there has been a massive upswing of 77.53% (after adjusting for inflation). Unlike the rest of the county, household median values have increased more than the rental values in Hoboken between 2000 and 2013. This could be studied further taking race, ethnicity, population distribution and other social factors into account, which are not the scope of this study.
Conclusions:
As a result of this investigation, several observations can be made.
Rental Values: There is an upswing in rental values throughout Hudson County, with a 45% increase in 2013 compared to the inflation adjusted values of 2000. Hoboken has performed significantly better than the rest of the county with an increase of 54%, making it a preferred destination for investment.
Impact of Rapid Transit: A comparative analysis between 2000 and 2013 indicates no definitive spatial pattern apart from the quarter mile radius from transit stations. This indicates the possibility that transit networks are not significantly influencing rental values, as the popular perception often suggests. Rental values in areas closer to transit stations continue to be higher than the rest of the county. Hoboken shows no distinctive spatial pattern in comparison to rental values and proximity to transit stations, indicating the possibility of other local factors having a more significant influence.
Household Income: The income throughout the county has increased by 20%, which is significantly lower than the overall increase in median rental values. This indicates that homeowners are at an advantage compared to residents who have opted for rental units since 2000. There was a massive increase of 77.53% in Hoboken between 2000 and 2013, indicating the possibility of gentrification within the region.
Market Summary: Investors and homeowners who held their property since 2000 are at an advantage in the County, with an upswing in rental values. Those within the quarter mile radius from transit stations have benefitted more than the rest of the county. It is essential to look at micro-level details while investing within the quarter-to-one-mile radius from transit stations, whose rental values have appreciated significantly lower than the rest of the county.
Similar studies can be applied to other areas in the region, and also the overall region for macro-level indicators. This study hopes to serve as a precedent for other areas and the overall metropolitan region. Hoboken is a lucrative destination for investing in the residential market, as it is able to attract higher-income households. With rental values increasing significantly higher than the rest of the county, this may be the case in Jersey City as well.
(Endnotes)
1. “Annual Estimates of the Resident Population: April 1, 2010 to July 1, 2014 – Combined Statistical Area; and for Puerto Rico – 2014 Population Estimates”. U.S. Census Bureau
2. “Most Public Transit Commuters in Cities with 50,000 to 250,000 Residents, Cars at Work,” backed up by the Internet Archive as of October 13, 2007
3. Kane, Joseph Nathan; and Aiken, Charles Curry. The American Counties: Origins of County Names, Dates of Creation, and Population Data, 1950-2000, p. 140. Scarecrow Press, 2005. ISBN 0810850362
4. New Jersey: 2010 – Population and Housing Unit Counts; 2010 Census of Population and Housing, p. 6, CPH-2-32. United States Census Bureau, August 2012, backed up by the Internet Archive as of July 31, 2013Rico
5. Erick Guerra, Robert Cervero, Daniel Tischler. 2011. “The Half-Mile Circle: Does It Best Represent Transit Station Catchments?” INSTITUTE OF TRANSPORTATION STUDIES 15.
6. John A. Kilpatrick, Ronald L. Throupe, John I. Carruthers, and Andrew Krause. 2007. The Impact of transit corridors on residential property values. JRER
7. Wardrip, Keith. 2011. “Public Transit’s Impact on Housing Costs: A Review of the Literature.” Insights for Housing Policy Research 12
