Central Business Districts (CBD) submarkets have historically been a sought-after office and retail asset market for international and local businesses. The concentration of commercial activity, people, and accessibility in the submarket incentivizes businesses to relocate and take advantage of clustering and agglomeration economies. CBDs often serve as a city’s financial or business district, making them an area of prime importance, and driving exceptionally high office, retail, and residential rents compared to other submarkets. [i]
However, there is notable evidence from recent reports that secondary submarket offices are experiencing significant growth in office inventory and sales volume, anticipated to outpace that of CBD submarkets. Secondary submarkets are defined areas within a broader market or city, typically more suburban and characterized by less density and larger residential communities compared to a CBD. The upward trend of the secondary markets’ demand caused office rents to be at par with that of the traditional metropolitan office neighborhood. This nationwide shift in demand was reported as early as 2011 and accelerated during the COVID-19 pandemic, speculatively due to tenant preference changes, hybrid work schedules, and office space expansions. This article reviews historical office real estate leasing and transaction trends in prevalent CBDs and secondary submarkets, and analyzes potential drivers of this shift.
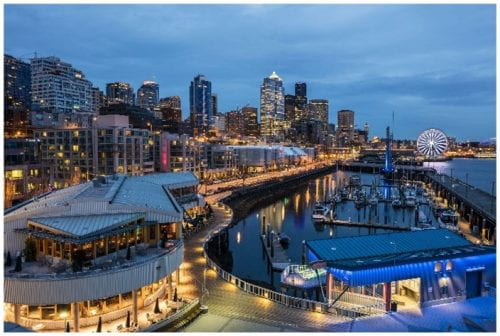
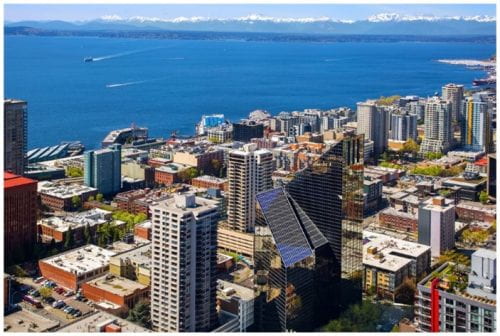
Figure 1: Downtown Seattle Figure 2: Belltown/Denny Regrade[ii]
Seattle, Washington
| Seattle Office Market Key Indicators | CBD [iii] [iv] [v] | Belltown/Denny Regrade [vi] [vii] | |
| Current Market Rent (Class A) | $47.70 |
> |
$45.07 |
| Year-over-Year (YOY) Rent Growth | 0.2% |
> |
0.1% |
| Historical Rent Growth | 1.3% |
> |
1.0% |
| Forecasted Average Rent Growth | 2.6% |
= |
2.6% |
| Historical Vacancy (YOY) | 10.8% |
> |
8.7% |
| Forecasted Average Vacancy (YOY) | 16.7% |
> |
10.1% |
| Total Asset Value | $23.6 B |
> |
$7.8 B |
| Market Cap Rate | 5.1% |
< |
5.3% |
| Sale Volume (12 Month) | $2.2B |
> |
$302M |
| Delivered Square Feet (Past 8Q) | 1,059,657 |
< |
2,925,753 |
Table 1: Seattle CBD & Belltown/Denny Regrade Office Market Key Indicators
In 2019, Seattle CBD saw a peak in office sales volume, with other area submarkets following suit in Q1 2020.[viii] This flow of capital into the office asset market resulted in Seattle’s overall compressed cap rate and a wave of development in all submarkets during that period. Other than the CBD, one of the strongest performing submarkets in the city is Belltown/Denny Regrade. Belltown/Denny Regrade is a culturally significant and trendy district located just north of the CBD district. The submarket is known to be bustling with activities and is home to affluent residential residents, upscale restaurants, art galleries, and nightclubs.[ix] The submarket has notably been making historically high sales volume in the past couple of years. The surge in sales volume could be linked to Amazon’s active presence in the submarket since 2012, noted by their large office space presence and development activity to expand and relocate their offices in this region.[x] Now, the firm is dominating the submarket with a total of 5 million square feet of office space, influencing other firms to relocate into the area.
The COVID-19 pandemic, however, left a lasting and lingering impact on the city’s overall office market which swiftly halted the city’s growth. The previously healthy real estate market was left in a distressed condition for the rest of 2020, with a large oversupply of office space and much more under construction. Although there are signs of a rebound in 2021 and 2022, the recovery lags due to the abundance of office space inventory, especially for the Seattle CBD submarket. Belltown/Denny Regrade was also heavily impacted by the pandemic, declining the YOY rent growth to 0.1%, down from the 10-year average of 4.3%. Nevertheless, this submarket is anticipated to recover to YOY rent growth of 2.6% in 2022, similar to Seattle CBD. This secondary office submarket is also forecasted to have an increased average vacancy rate of 10.1%, however, still 6.6% lower than the CBD projected vacancy rate.
The submarket’s anticipated steady recovery is due in part to companies’ preferences to be within proximity of Amazon, as well as rising demand for urban locations closer to high-end apartments. The increase in demand is influenced by the migration of younger workers to mixed-use high-end residential locations, as they pursue a live-work-play environment amidst the hybrid work culture. Companies now are incentivized to relocate closer to these demographics in order to attract more high-skilled workers into their firms. Relocating also has the added benefit of enjoying lower rents in newer and well-amenitized office properties.

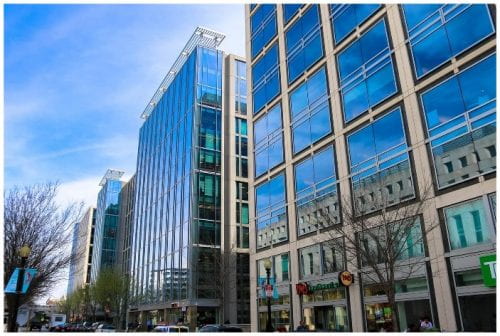
Figure 3: Downtown Washington D.C. [xi] Figure 4: NoMa[xii]
Washington D.C.
| Washington D.C. Office Market Key Indicators | CBD[xiii][xiv] | NoMa[xv][xvi] | |
| Current Market Rent (Class A) | $54.81 |
> |
$49.87 |
| YOY Rent Growth | -0.2% |
> |
-1.4% |
| Historical Rent Growth | 2.2% |
= |
2.2% |
| Forecasted Average Rent Growth | 2.7% |
< |
2.8% |
| Historical Vacancy (YOY) | 9.1% |
< |
14.3% |
| Forecasted Average Vacancy (YOY) | 16.0% |
> |
6.6% |
| Total Asset Value | $26.6 B |
> |
$6.6 B |
| Market Cap Rate | 5.8% |
< |
6.1% |
| Sale Volume (12 Month) | $484.2M |
< |
$509.1M |
Table 2: Washington D.C. CBD & NoMa Office Market Key Indicators
Historically, Washington D.C.’s CBD has consistently been a sought-after trophy office space, boasting approximately 50 million SF of office space with a total asset value of $26.6 B. The submarket has always had premium office rents due to its unrivaled location, but also offers ample affordable office options, making it an attractive market for many firms. However, this submarket is one of the hardest hit by the pandemic, making historical negative net absorption and virtually no transactions for the first half of 2021. The recovery outlook for this market is anticipated to be slow and difficult, as reports show slowdowns in leasing, poor net absorption, and a rise in vacancy rate.
The source of the slow recovery can be attributed to the aging office inventories in the submarket. With more than half of the existing office spaces built prior to 1980, the amenities and specifications of these older assets do not meet the needs of prospective tenants and investors. The leasing landscape today requires newer office layouts with the flexibility to incorporate a hybrid workspace, support work-life balance, access to technology, and many other factors. The rigid structure of the aging office spaces in the CBD, coupled with the high rent (highest rates in the market), allows other areas to outcompete the CBD in the office market space. Not only that, with large existing office assets and incoming inventory from other submarkets, the CBD is continuously suffering from office oversupply, stagnant demand, and declining occupancy. [xvii] The CBD is now in a predicament as they determine whether to develop new offices in the midst of potential oversupply, as well as growing uncertainty of their ability to compete with office assets in other submarkets, which are well-amenitized with lower rents.
Office tenant prospects now investigate other submarkets to relocate and expand to. Many articles have reported capital flow into Bethesda, East End, Tysons Corner, and Reston, with NoMa taking the lead in this growth.[xviii] CoStar acknowledges NoMa as the top institutional market in Washington D.C., with one of the fastest population growths in the metro area. NoMa has shown resiliency throughout the pandemic and has a positive prospect for a strong recovery. The current vacancy rate for the submarket is reported to be 7.1% and forecasted to further reduce to 6.6%, a rate 10% lower than CBD. Sales volume for the past year has also outpaced the CBD, with rents rising at the same pace as CBD. All-in-all, NoMa is anticipated to be the next leading submarket in Washington D.C., amplified by the growth, resilience, and tenant preferences over the next few years.
Conclusion
Many markets have seen indications of decreasing investor interest in the CBD office market even prior to the pandemic, due to either the shift in demographics workforce or tenants’ needs for newer state-of-the-art office spaces. The office asset class was profoundly impacted by the COVID-19 pandemic, resulting in historically poor performance and absorption, but also accelerating existing workplace trends and technology, as shown in the Seattle and Washington D.C. market examples. CBDs are historically sought after neighborhoods but tend to have the short stick with this transition due to limited space, inflexible office layouts, and unpopular working environments, motivating the relocation of firms into the other submarkets. Other submarkets have the advantage of vibrant and diverse mixed-use environments which entice both talent and firms alike. It will be interesting to see the future of offices in the CBD as stakeholders and city planners evaluate this transition and strategize ways to increase the flow of capital back into these submarkets.
References
[i] Jagannath, T., 2020. Central Business District (CBD) | Characteristics, Examples, Pros and Cons. [online] Planning Tank. Available at: https://planningtank.com/city-insight/central-business-district-cbd [Accessed 15 March 2022].
[ii] Martin Selig Real Estate, 2018. Neighborhood Spotlight: Belltown. [online] Martin Selig Real Estate. Available at: https://martinselig.com/neighborhood-spotlight-belltown/ [Accessed 2 May 2022].
[iii] CoStar, 2022. Seattle CBD 22Q1 Office Submarket Report. 22Q1 Office Submarket Report. [online] Available at: <https://www.costar.com/> [Accessed 14 March 2022].
[iv] CoStar, 2022. Seattle CBD 22Q1 Office Capital Market Reports. 22Q1 Office Capital Market Reports. [online] Available at: <https://www.costar.com/> [Accessed 14 March 2022].
[v] Cushman & Wakefield, 2022. Seattle CBD 21Q3 Office Market Report. 21Q3 Office Market Report. [online] Available at: < https://www.cushmanwakefield.com/en/united-states/insights/us-marketbeats/seattle-bellevue-marketbeats > [Accessed 15 March 2022].
[vi] CoStar, 2022. Belltown/Denny Regrade 22Q1 Office Submarket Report. 22Q1 Office Submarket Report. [online] Available at: <https://www.costar.com/> [Accessed 14 March 2022].
[vii] CoStar, 2022. Belltown/Denny Regrade 22Q1 Office Capital Market Reports. 22Q1 Office Capital Market Reports. [online] Available at: <https://www.costar.com/> [Accessed 14 March 2022].
[viii] CoStar, 2022. Seattle CBD 22Q1 Office Submarket Report. 22Q1 Office Submarket Report. [online] Available at: <https://www.costar.com/> [Accessed 14 March 2022].
[ix] Crowley, W., 1999. Seattle Neighborhoods: Belltown-Denny Regrade. [online] Historylink.org. Available at: <https://www.historylink.org/File/1123> [Accessed 17 March 2022].
[x] Pryne, E., 2012. Amazon puts its stamp on downtown Seattle. [online] The Seattle Times. Available at: <https://www.seattletimes.com/business/amazon-puts-its-stamp-on-downtown-seattle/> [Accessed 17 March 2022].
[xi] Clabaugh, J., 2017. Met Square in Downtown DC set for facelift. [online] wtopnews. Available at: https://wtop.com/business-finance/2017/10/major-renovation-prominent-dc-building-met-square/ [Accessed 2 May 2022].
[xii] Long & Foster Real Estate, N/A. NoMa Washington, District of Columbia. [online] Long & Foster Real Estate. Available at: https://www.longandfoster.com/DC/Washington/NoMa [Accessed 2 May 2022].
[xiii] CoStar, 2022. Washington – DC CBD 22Q1 Office Submarket Report. 22Q1 Office Submarket Report. [online] Available at: <https://www.costar.com/> [Accessed 28 March 2022].
[xiv] CoStar, 2022. Washington – DC CBD 22Q1 Office Capital Market Reports. 22Q1 Office Capital Market Reports. [online] Available at: <https://www.costar.com/> [Accessed 28 March 2022].
[xv] CoStar, 2022. NoMa 22Q1 Office Submarket Report. 22Q1 Office Submarket Report. [online] Available at: <https://www.costar.com/> [Accessed 28 March 2022].
[xvi] CoStar, 2022. NoMa 22Q1 Office Capital Market Reports. 22Q1 Office Capital Market Reports. [online] Available at: <https://www.costar.com/> [Accessed 28 March 2022].
[xvii] 2016. Growing Trend – Advantages of Locating Office Product in Mixed-Use Projects and Neighborhood. [ebook] HRA. Available at: https://www.nomabid.org/wp-content/uploads/sites/4/2017/09/HRA-Study-2016.pdf [Accessed 20 March 2022].
[xviii] Banister, J., 2017. Tale Of Two Cities: D.C.’s Core Office Market Struggles As Emerging Areas Strengthen. [online] Bisnow. Available at: <https://www.bisnow.com/washington-dc/news/office/tale-of-two-cities-dcs-core-office-market-struggles-as-emerging-areas-grow-79970> [Accessed 19 March 2022].
